SEO is a constantly updating thing in the world of Internet. Search engines update their algorithms frequently so there needs to change strategies and tactics to SEO professionals. Every SEO organization and SEO professional have to be updated all the time.
One has to apply SEO strategies according to current algorithm and SEO rules. We can not invent our own techniques as we are bound to follow rules of search engine algorithm. In this case we can do one thing with Data Analysis and that is Data Visualization Revolution.
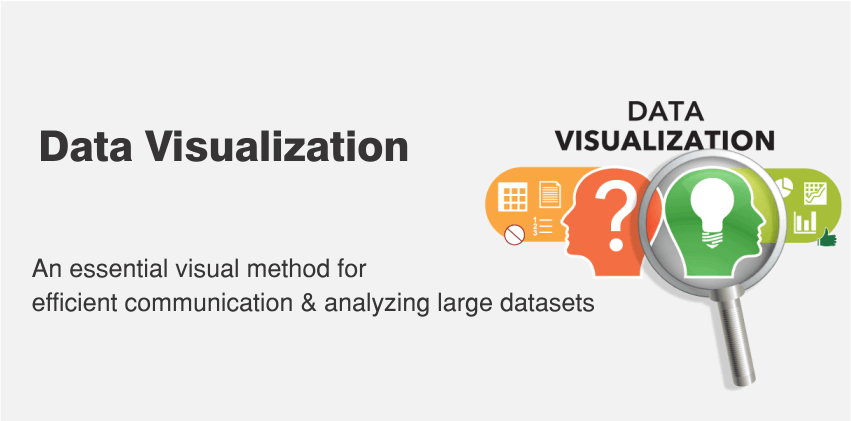
Data Visualization-
The concept of Data Visualization is very basic. Data is a very important and useful tool as it provides in depth information on related subject. To make it effective the information should be related to subject, precise and correct. Human minds are depending on designs in visual demonstrations, pictures, and videos. This helps us to analyze meaningful data at a glance.
Data visualization is bound with these needs together, interpreting data in visual, sometimes interactive way. In short, In SEO it's not important to introduce new charts and graphs rather show the important SEO data and value behind it with the help of tools.
Advantages for SEO
Raw efficiency increases-
To begin with, think about the raw efficiency expands a visual mapping of information could bring you. As opposed to chasing down the correct data sets, changing your factors, and tinkering with different custom reports, you'll be met with an interactive display. You won't need to pick through individual bits of information to discover the conclusions you need; you'll have the capacity to shape your decisions speedier, to some degree intuitively.
Approachability for novices-
Everybody is unexperience about anything at some time. So we have gone through the bad dreams of tremendous data with no idea of how to interpret it. At this time you may gone through Google analytics data and it's many factors and variables you are unaware about. We can solve this problem with solid suit of Data Visualization program where novices have no need to understand all the complex data, They can only depend on the sense where the campaign is headed what to do next.
Isolation of variables-
One of the most concerning issues in SEO information examination is separating the correct factors. If you want to check the factors responsible for website traffic you will get many factors like because of new links, removal of old one, fluctuation of user behavior and many more. Here you will get confused about real factor for increased traffic. But with the help of Data Visualization you will come to know about all these independent factors and how they are meld together to give a final result.
Interactivity-
Most optimizers need a degree of interactivity in data, which is a positive point. And Data Visualization needs a degree of interactivity which is a good thing for SEO Analysis. A good visual should contain on-the-fly customization where analyst could add or remove filters and variables to make it more interactive and work in real time. This may help analysts to experiment with data.